

Formula 1 TV Graphics
Graphics for Formula 1 broadcasting, taking data presentation and information graphics to new heights.
Enhanced information and layouts
Enhancement of the current graphics set, exploring new information layout possibilities, as well as focusing more on the identity of the drivers, making them the stars of the show.
Formula 1 has never looked better
With a consistent visual identity, with graphic devices, typography and layout grids, Formula 1 coverage has never looked better.

Championship colour schemes
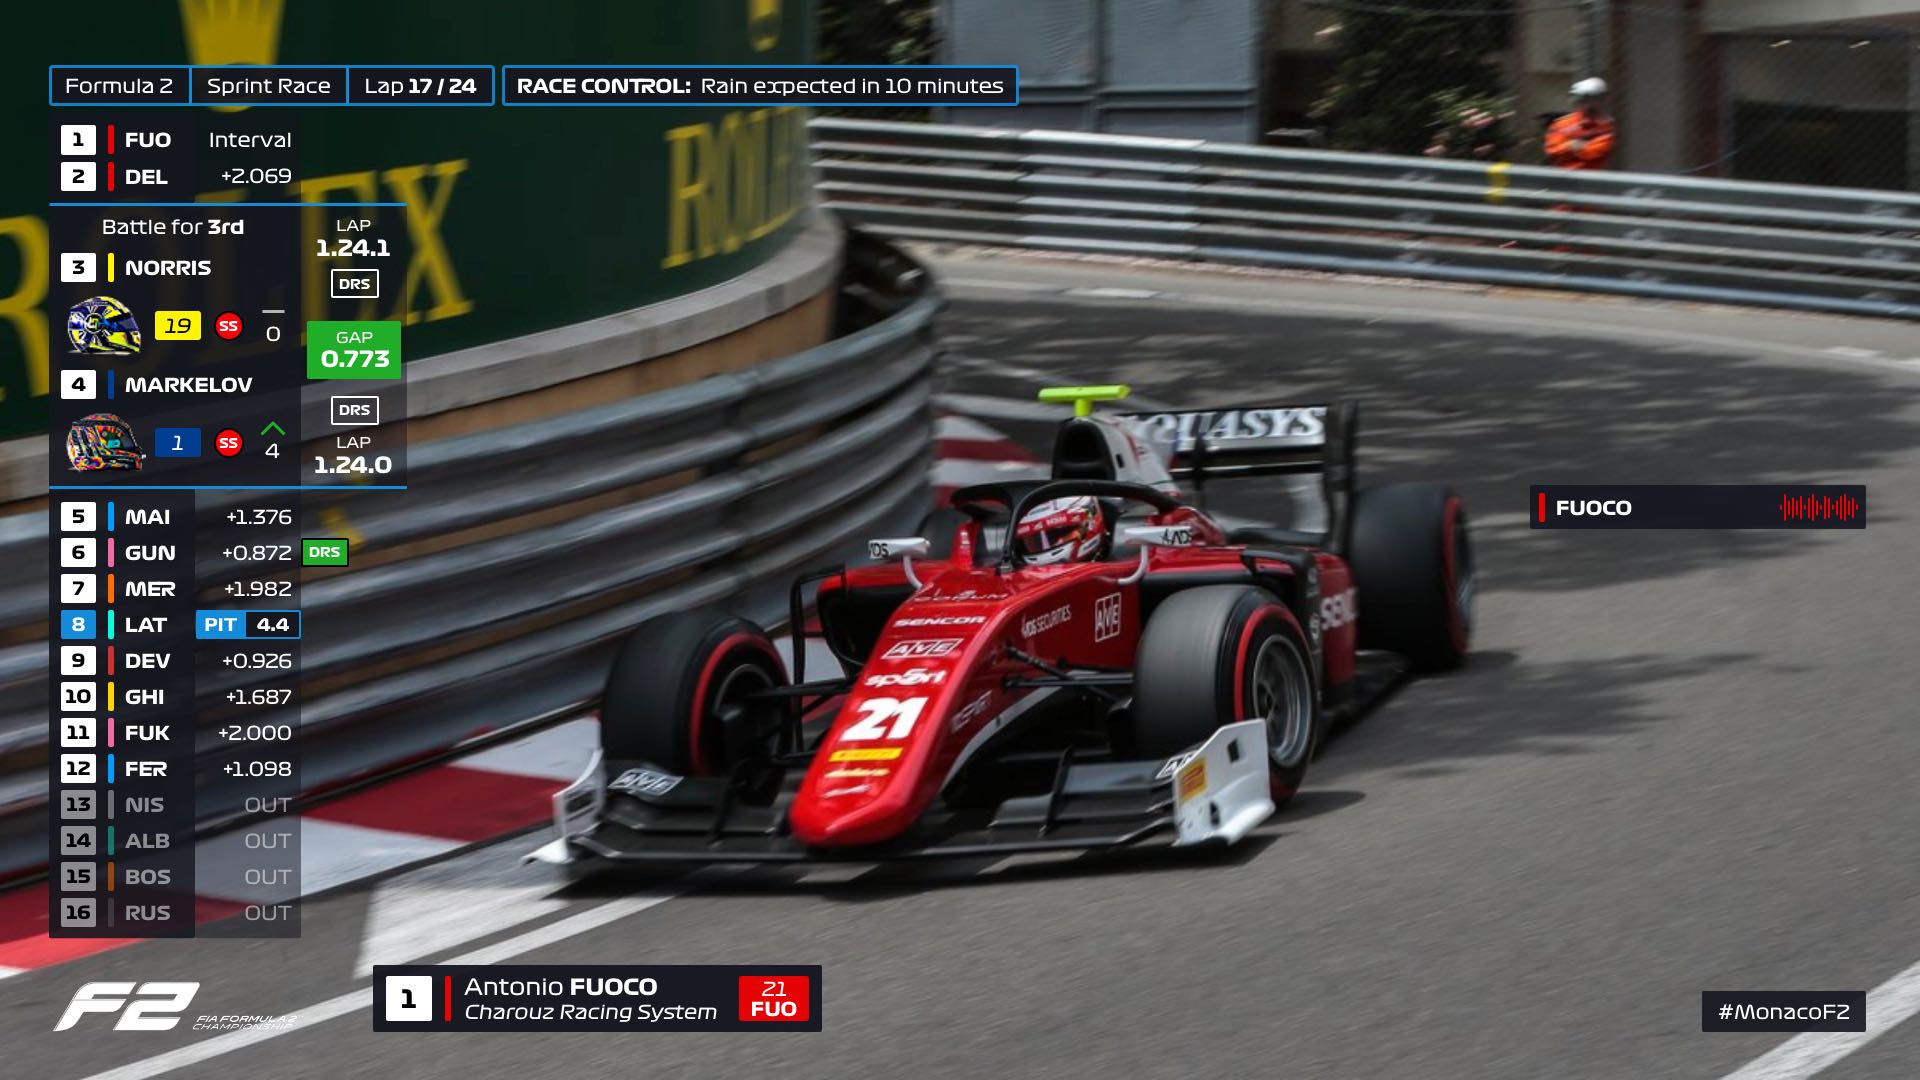
Formula 1’s colour is bright red, and red lines and boxes are used to highlight key information. The colours change when Formula 2 (light blue) and Formula 3 (silver) race, making it clear to new and casual viewers what championship they are watching.
Status Bar
Running across the top of the screen, the Status Bar houses the key information about the race or session, including the lap counter / timer, as well as flags and race control messages. There is also now a box in the left corner saying ‘Formula 1′, (or ‘Formula 2′ / ‘Formula 3′), which is constant throughout the broadcast.

Introduction screen
Shown at the start of all sessions, overviewing the country and session that’s about to happen.

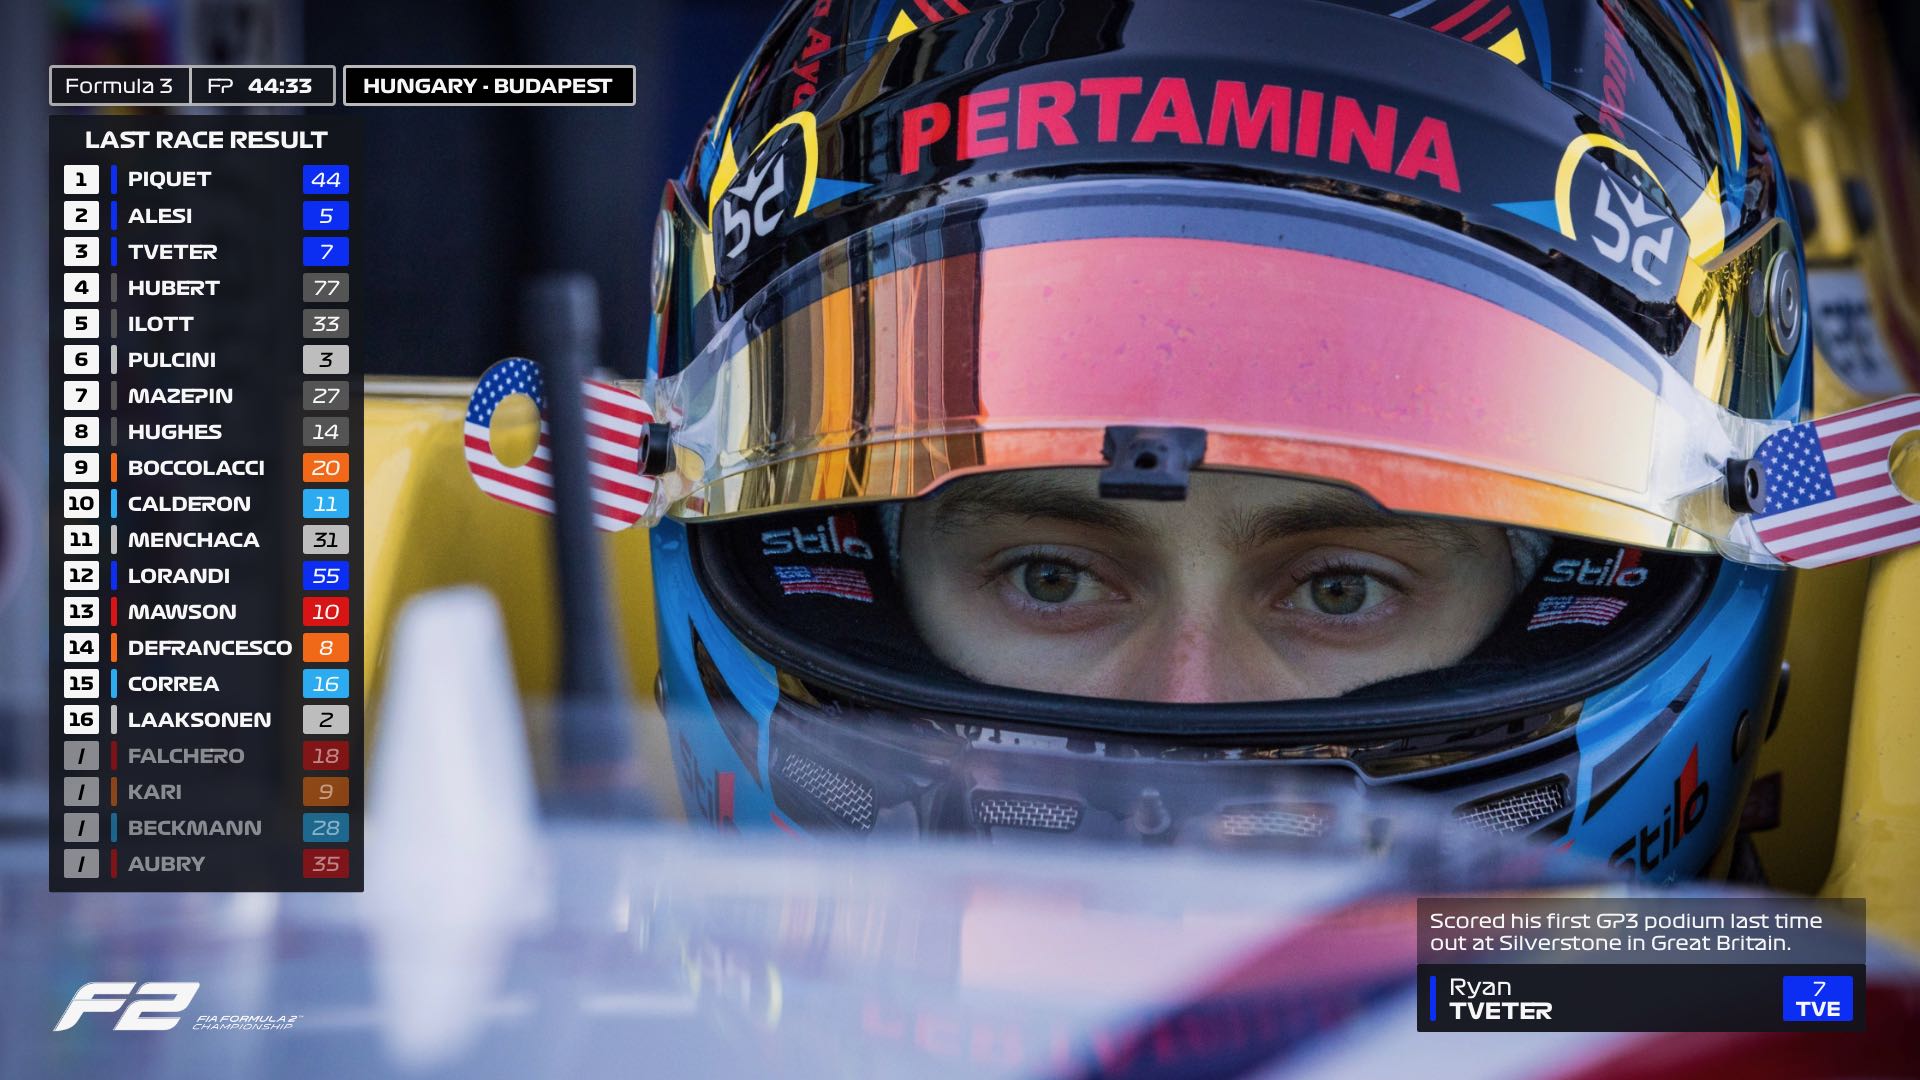
Driver statistics
Perfect for displaying short pieces of information about a driver.
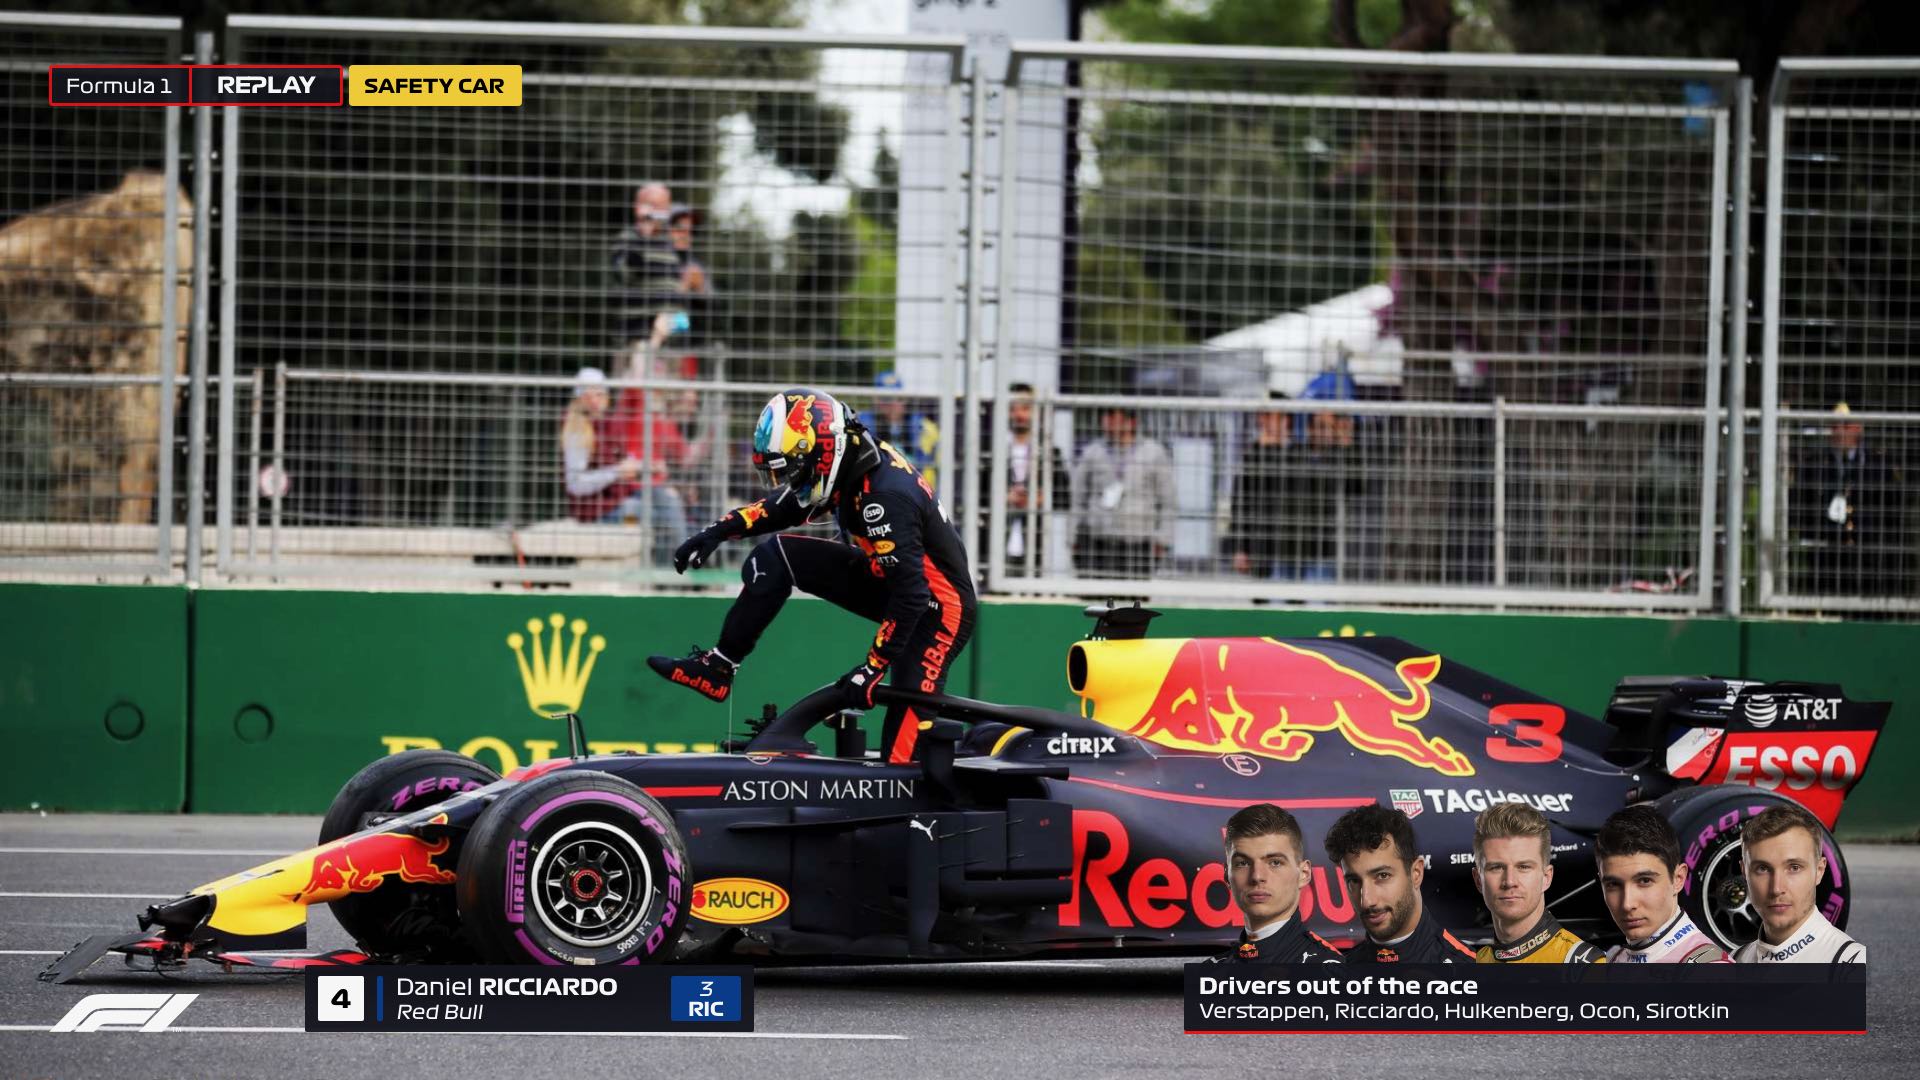
Drivers out of the Race
To be shown when there are multiple drivers out of the race, with driver imagery supporting this.
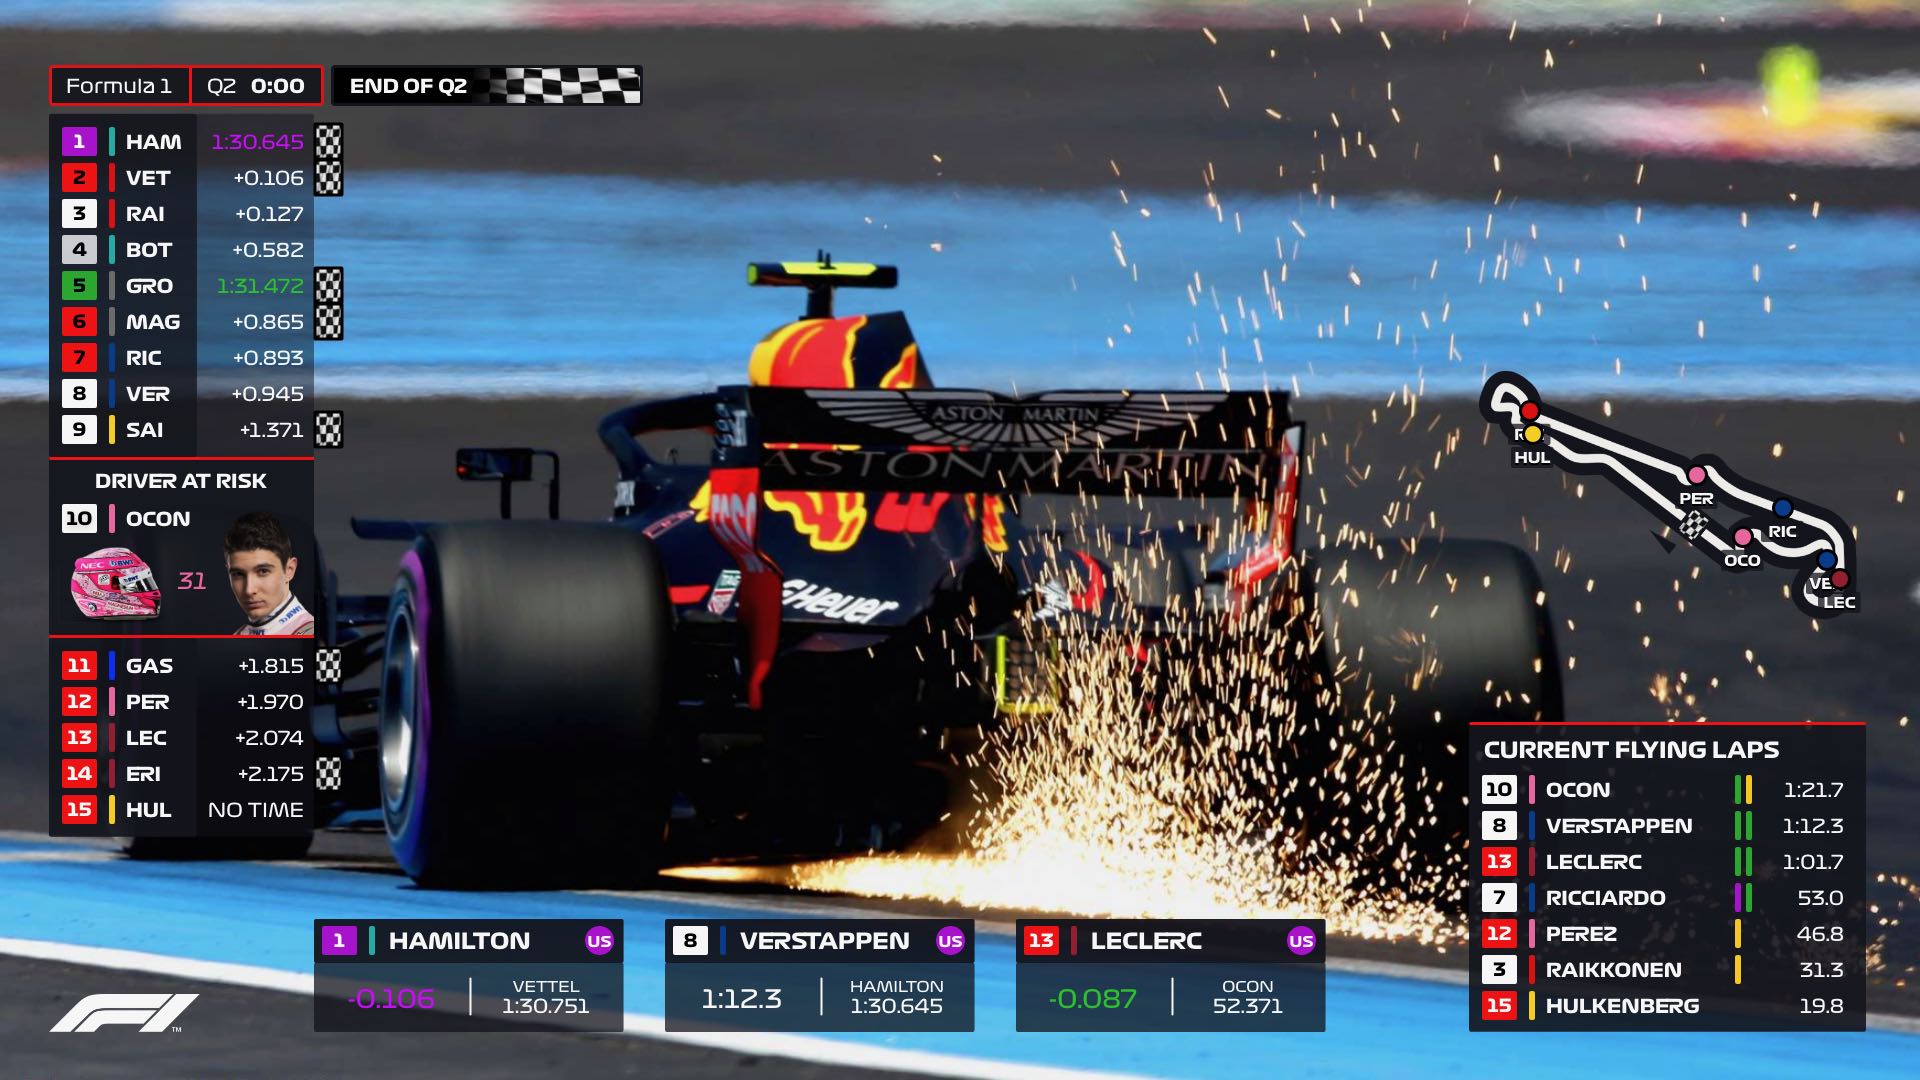
Flying lap chart
The new Flying Lap chart is constantly in the bottom right corner, showing each driver who is on a quick lap, in the order they crossed the line.
Sector colours
There are three sectors during a lap, and next to each drivers’ name and lap time are sector bars, which change colour depending on their pace. Green for personal best, yellow for slower sectors, and purple for session best.
Live driver tracker
Each driver on a quick lap will also appear on the track map above the Flying Lap chart, so viewers know when to expect a driver to set a time.
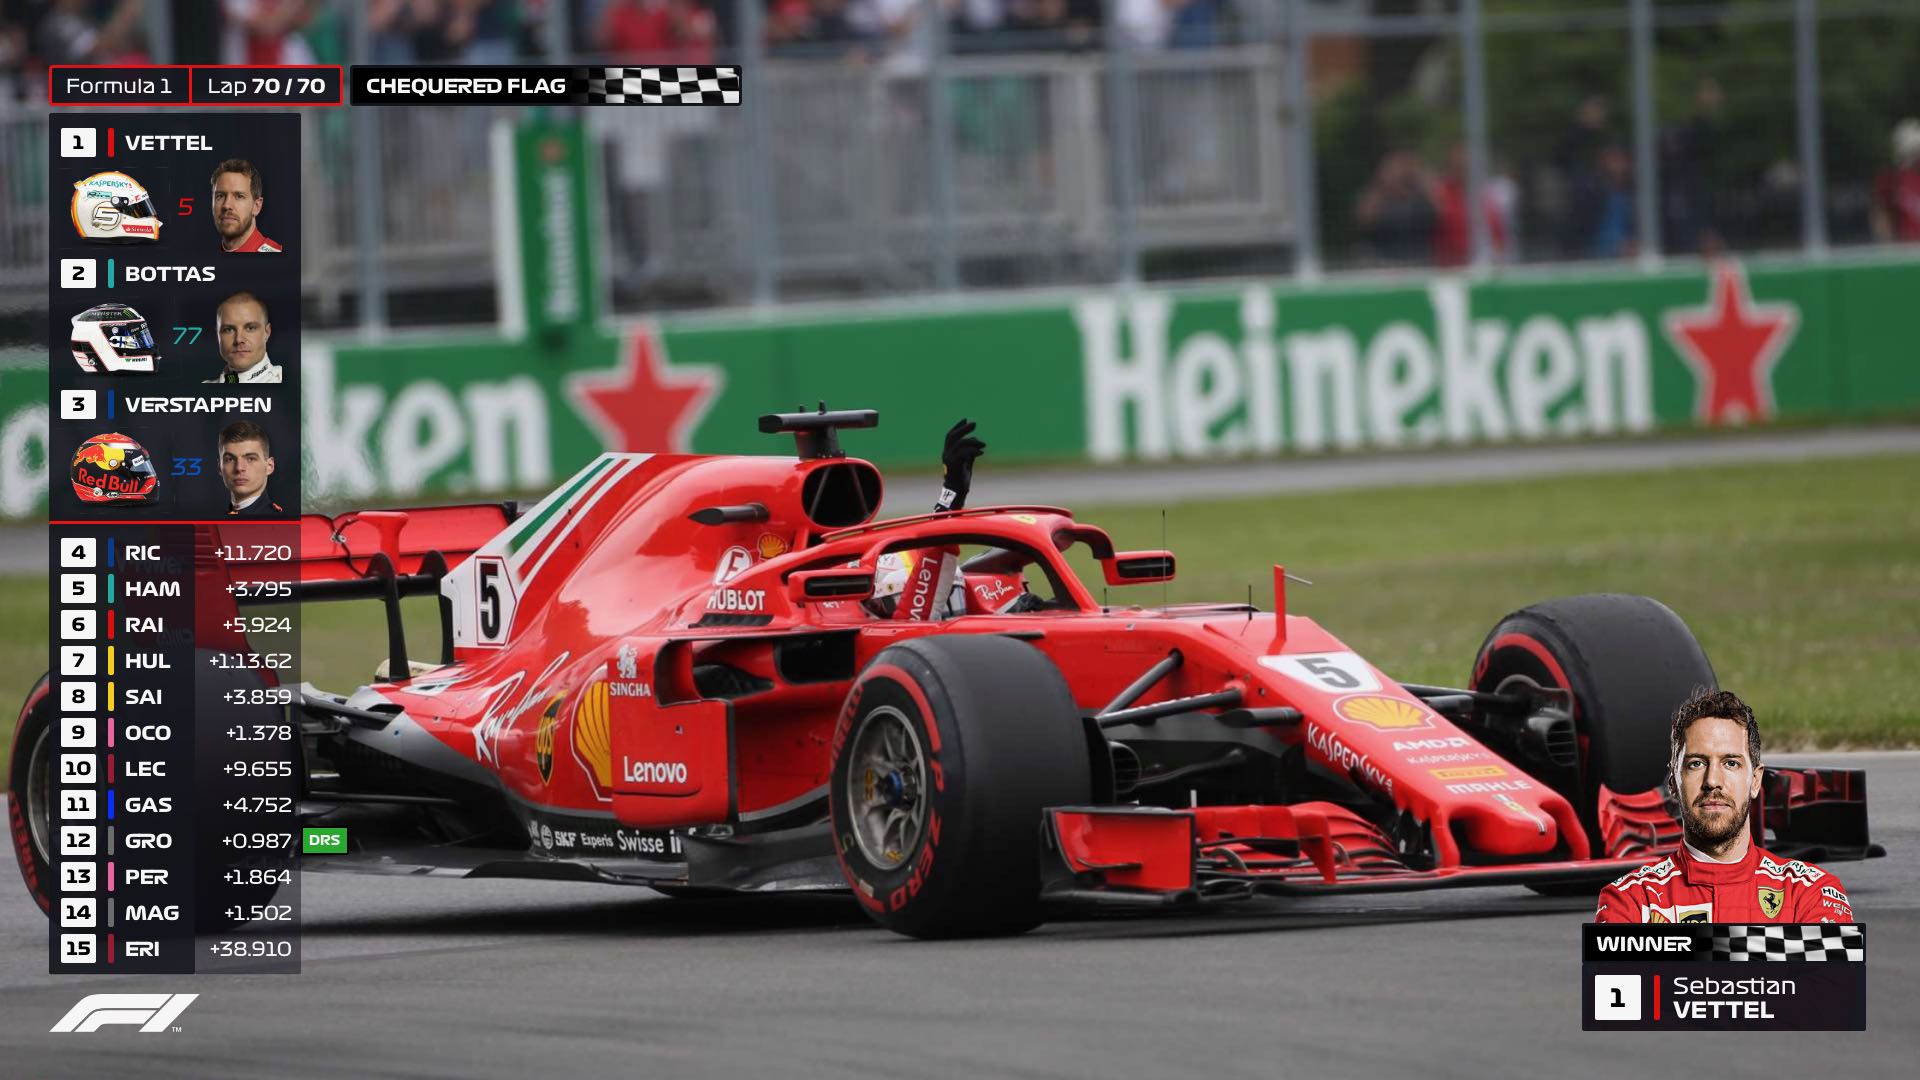
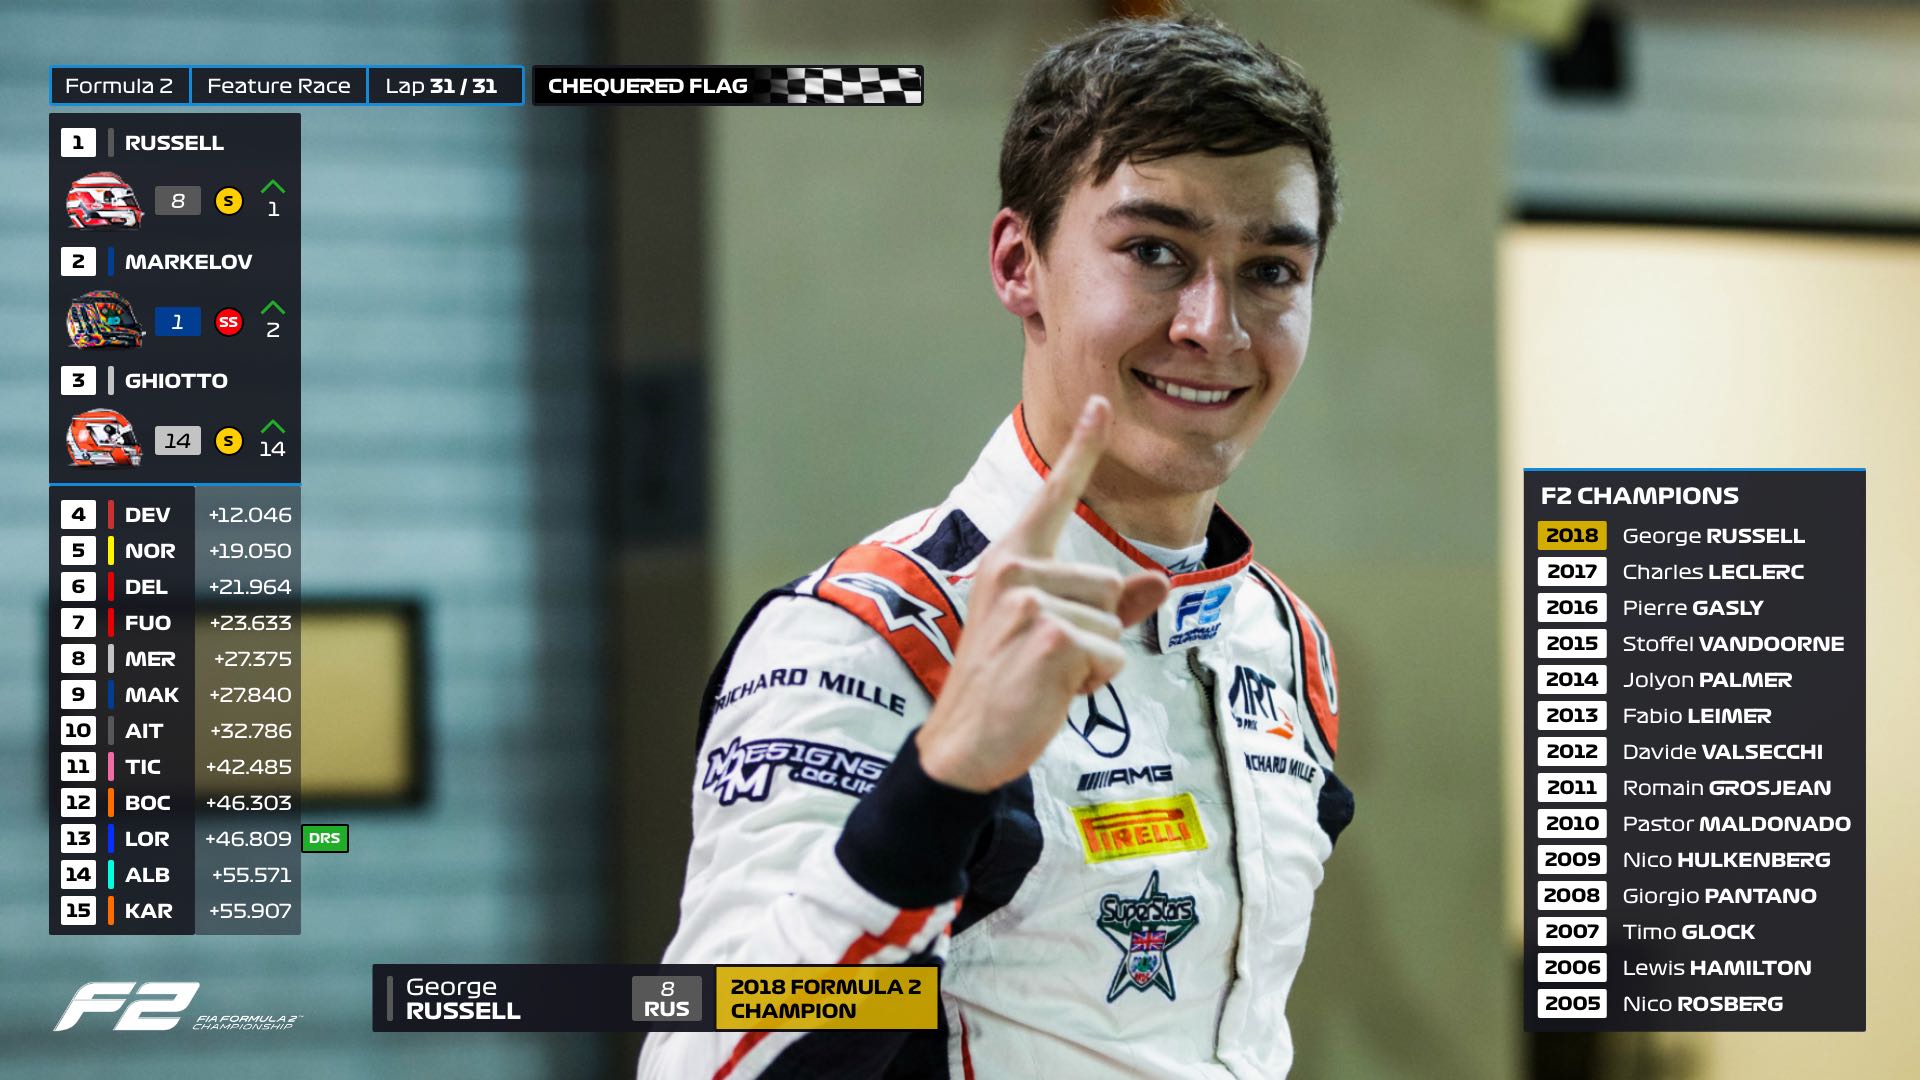
Chequered flag
Top three highlighted in the timing tower, and a special graphic for the race winner.

Championship graphics and team radio
Gold colour scheme to be used exclusively for championship graphics, also with team radio.

Driver of the Day
Faces to support the Driver of the Day vote message, acting as a cue to get people to vote.

Data for multiple drivers
The new graphics can show multiple pieces of complex data, which is useful for comparing pace and driving styles of drivers in a battle, as shown in the example here. You can see gaps, position difference, tyres, gears, speed, throttle and braking traces, and lap time comparisons.
Team radio
The colour and image changes depending on the driver and their team. This is enhancing the identity of the driver in the viewer’s mind.
DRS graphic
A new small graphic on the timing tower, appearing when a driver is using DRS.

Safety Car and pit stops
Additional info about the SC in the status bar, and pit stop data is now in the timing tower.

Hashtag
When there isn’t data to be shown, a subtle hashtag can be displayed in the corner.

Status bar and battle graphics
Race control messages within the status bar, and multiple graphics to focus on battles.
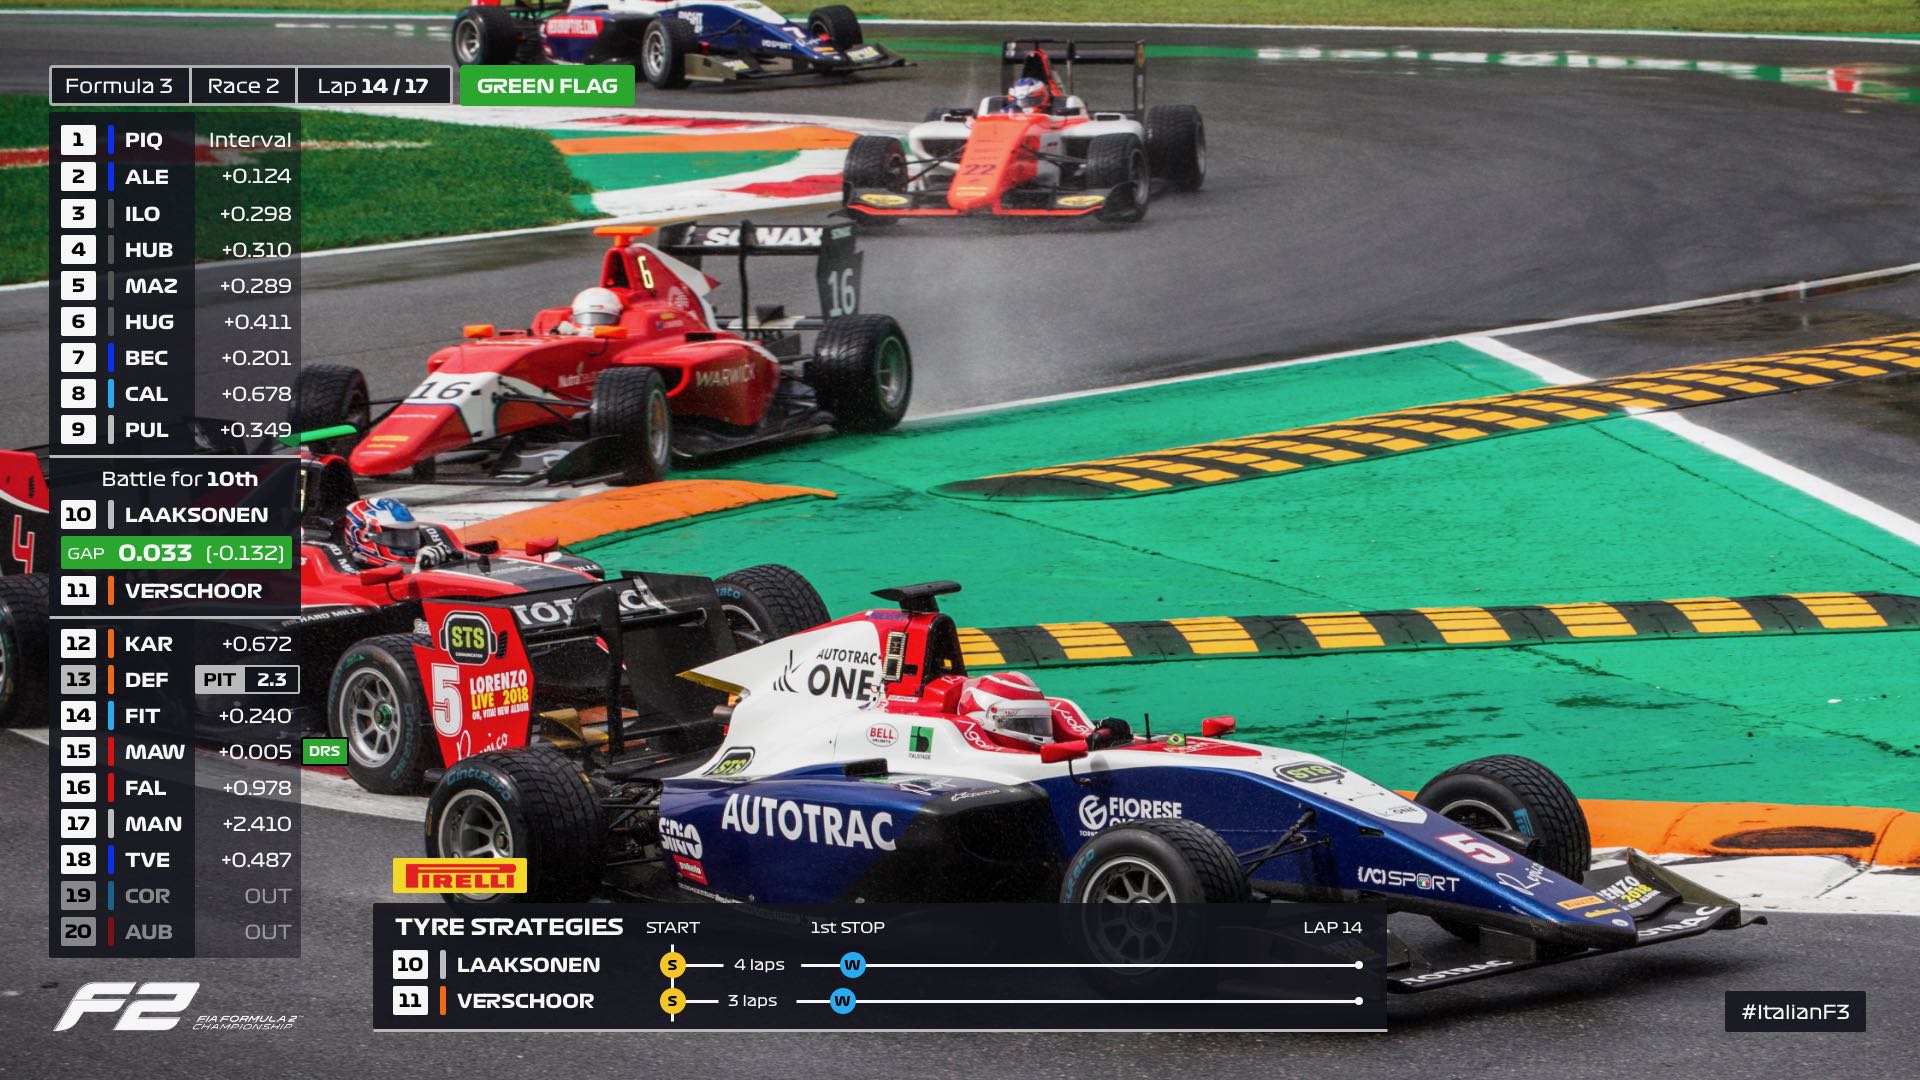
Timing tower customisation
The timing tower can change depending on what the director wants to focus on. It can display individual data, highlight specific battles, show gaps to other drivers, display position changes, pit stops and more.
Tyre strategies
The main graphic shows a comparison of tyre strategies, with imagery to connect the names to the faces underneath the helmets.
Blue flags
You can see when drivers are being lapped because their position box will turn blue.


Data for multiple drivers
The new graphics can show multiple pieces of complex data, which is useful for comparing pace and driving styles of drivers in a battle, as shown in the example here. You can see gaps, position difference, tyres, gears, speed, throttle and braking traces, and lap time comparisons.
Team radio
The colour and image changes depending on the driver and their team. This is enhancing the identity of the driver in the viewer’s mind.
DRS graphic
A new small graphic on the timing tower, appearing when a driver is using DRS.
Hashtag
When there isn’t data to be shown, a subtle hashtag can be displayed in the corner.

Safety Car and pit stops
Additional info about the SC in the status bar, and pit stop data is now in the timing tower.
Status bar and battle graphics
Race control messages within the status bar, and multiple graphics to focus on battles.
Timing tower customisation
The timing tower can change depending on what the director wants to focus on. It can display individual data, highlight specific battles, show gaps to other drivers, display position changes, pit stops and more.
Tyre strategies
The main graphic shows a comparison of tyre strategies, with imagery to connect the names to the faces underneath the helmets.
Blue flags
You can see when drivers are being lapped because their position box will turn blue.

Hashtag
When there isn’t data to be shown, a subtle hashtag can be displayed in the corner.
Safety Car and pit stops
Additional info about the SC in the status bar, and pit stop data is now in the timing tower.

Status bar and battle graphics
Race control messages within the status bar, and multiple graphics to focus on battles.